Client Results
Brand 04

Hyper ToughPaid Media Report

YouTube · Google Ads · May & June 2026 · via Wetpaint Advertising

Note: end of July 2026 metrics are not fully complete, as several campaigns were still running at the time of reporting. Spend managed reflects the monthly budget run across May, June and July.

Consistent subscriber over-delivery against target across both reporting months, with spend deliberately weighted toward subscription objectives.

R28.5K
Spend managed (May: July)
1.39M
Impressions
6,441
New subscribers

KPI Performance: May 2026

MetricEstimated KPIActual result
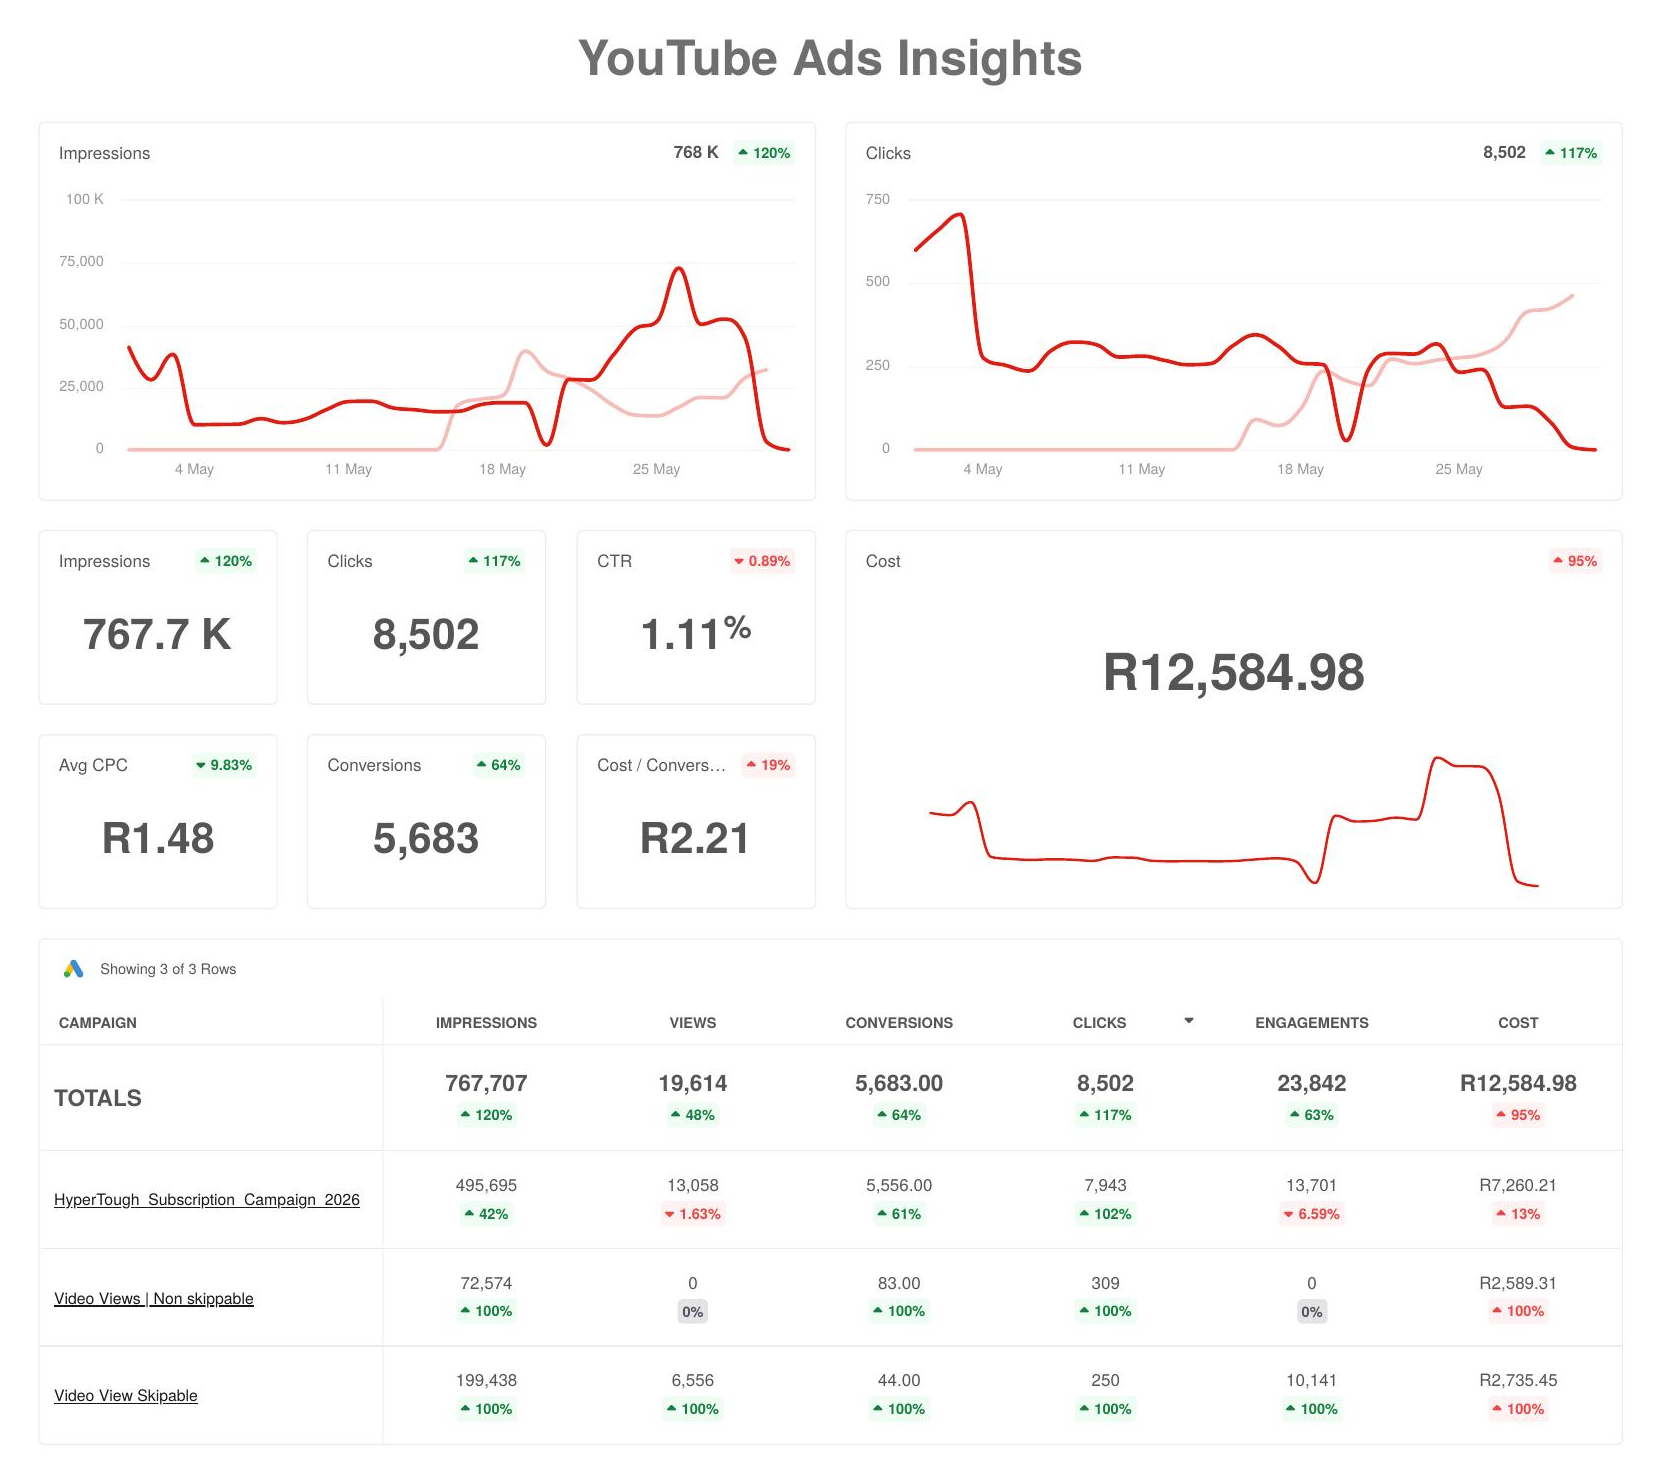
SpendR12,500R12,584.98
Impressions441,861767,707
Views (Paid Advertising)17,00019,614
Clicks2,5008,502
Engagement (Total Interactions)95,00023,842
New Subscribers1,6104,269

KPI Performance: June 2026

MetricEstimated KPIActual result
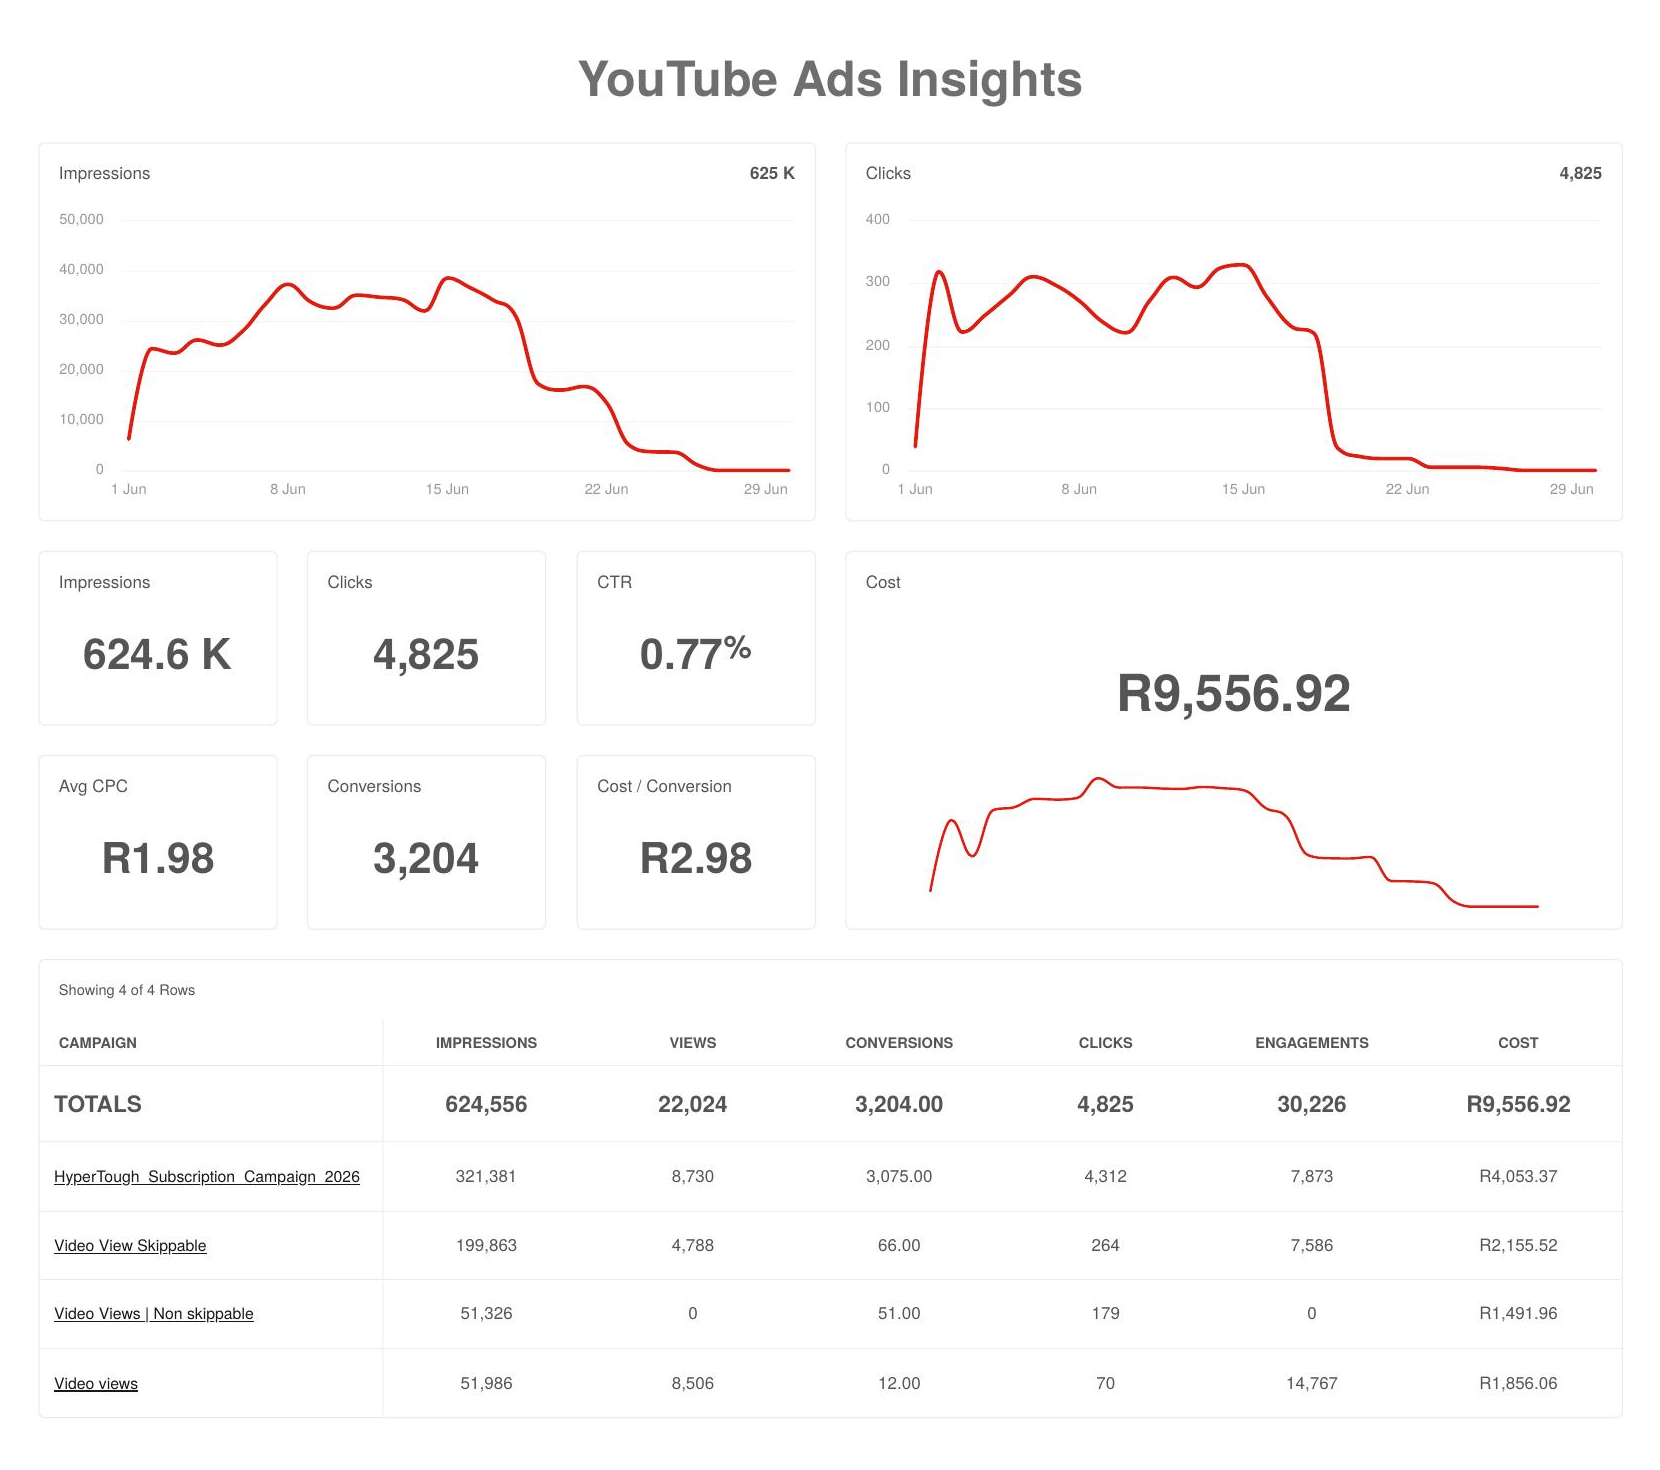
SpendR9,500R9,556.92
Impressions441,861624,556
Views (Paid Advertising)17,00022,024
Clicks2,5004,825
Engagement (Total Interactions)95,00030,226
New Subscribers1,6102,172

Account screenshots

Pulled directly from the live ad and analytics accounts for the reporting period.

Hyper Tough: YouTube Analytics: May 2026
YouTube Analytics: May 2026
Hyper Tough: YouTube Analytics: June 2026
YouTube Analytics: June 2026
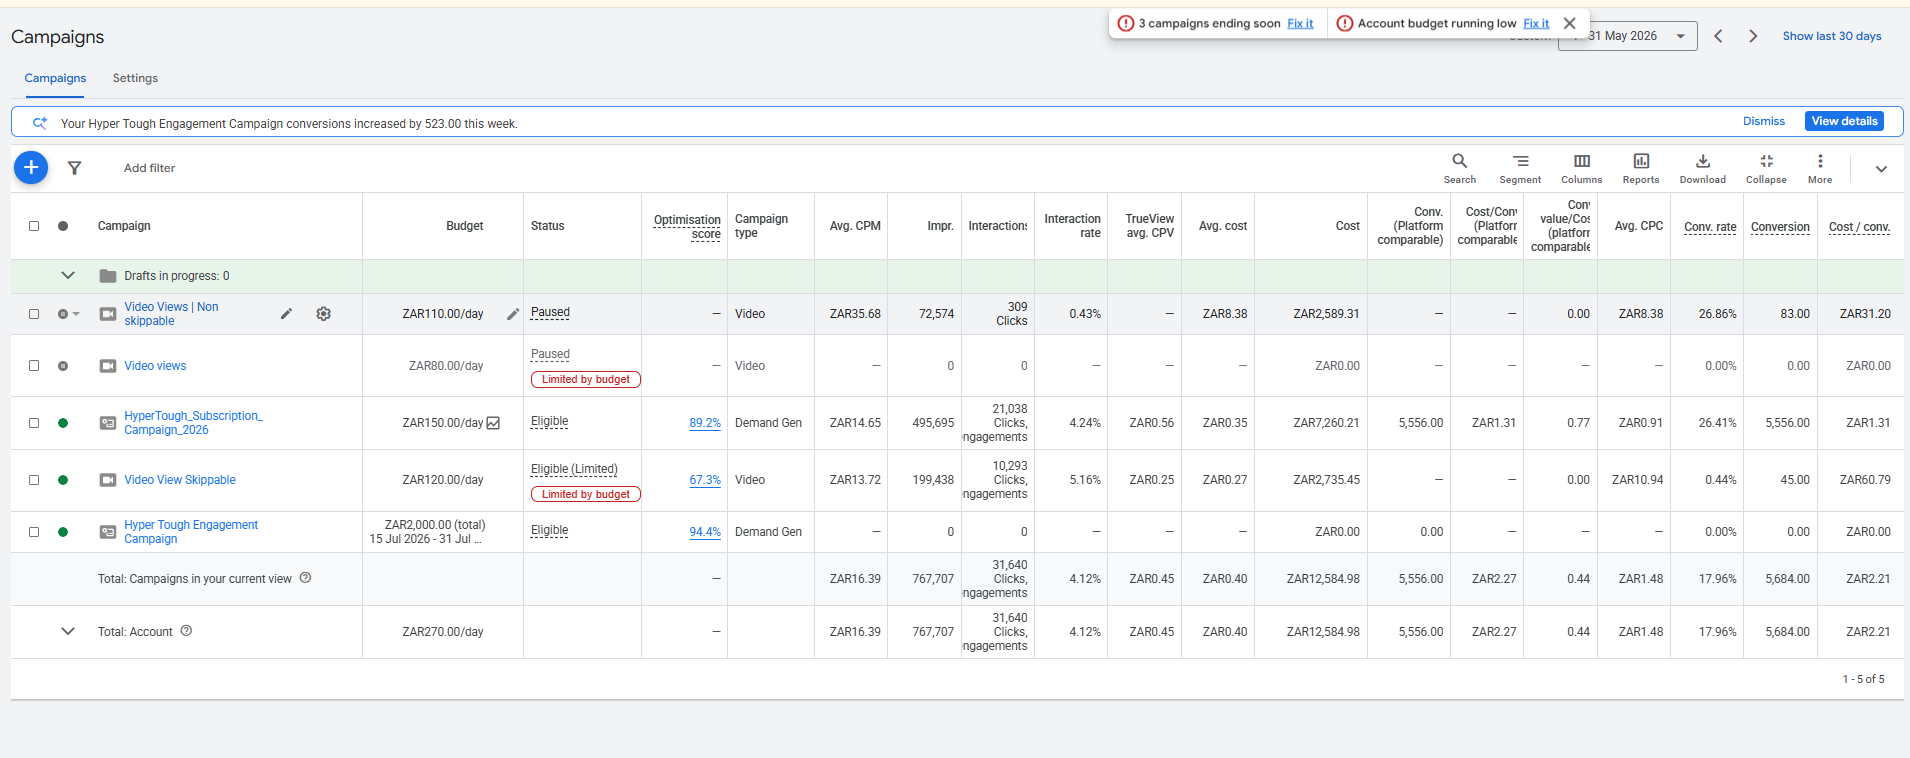
Hyper Tough: Google Ads Campaigns: May 2026
Google Ads Campaigns: May 2026
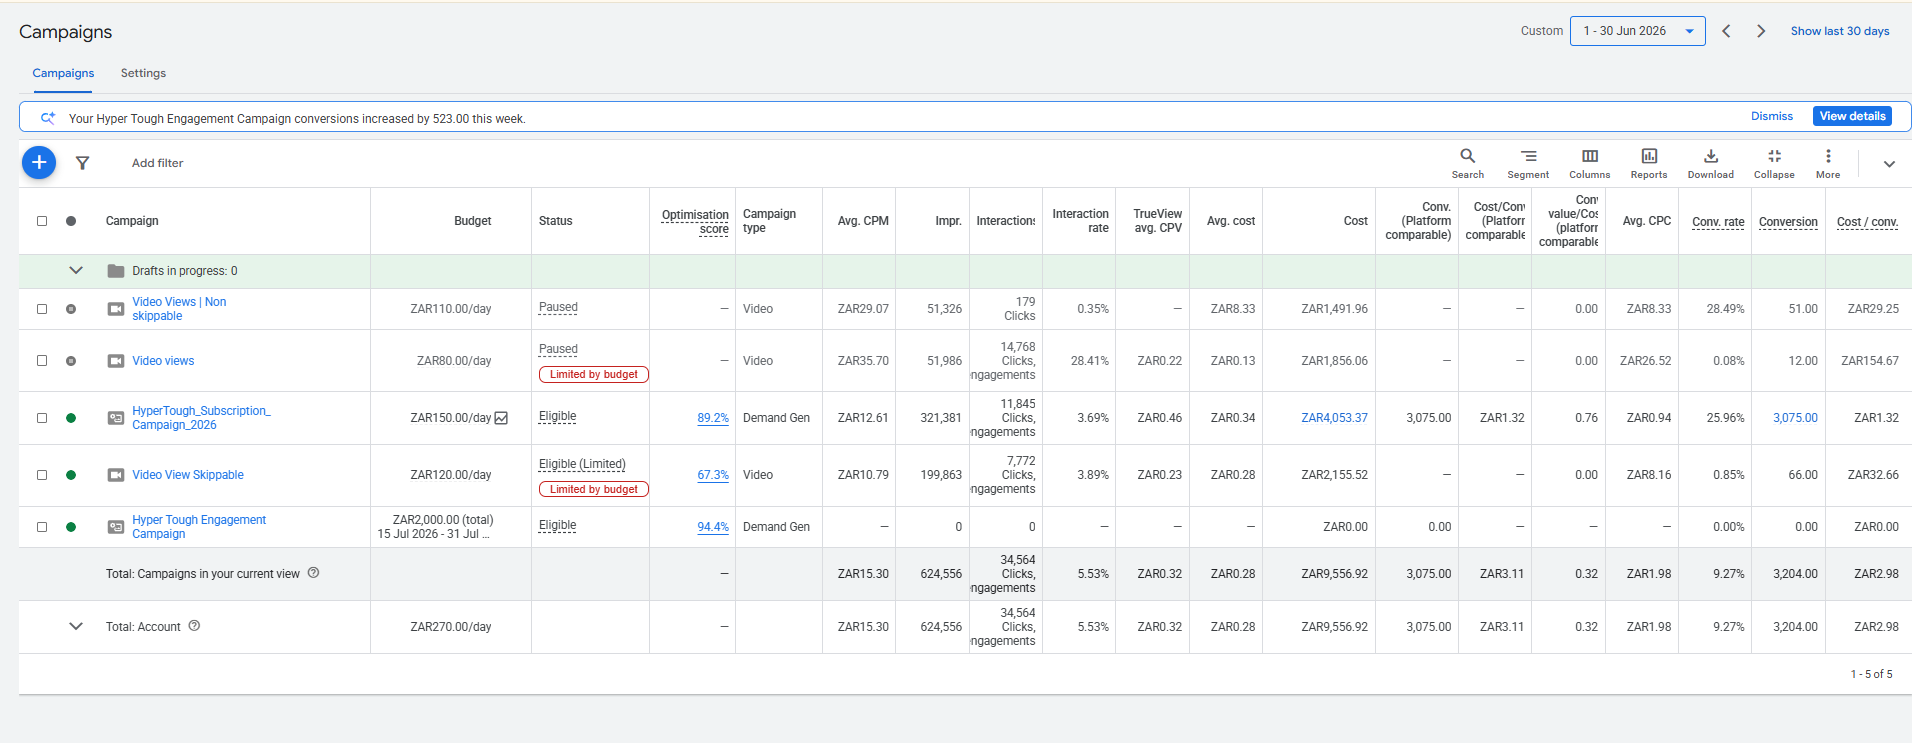
Hyper Tough: Google Ads Campaigns: June 2026
Google Ads Campaigns: June 2026
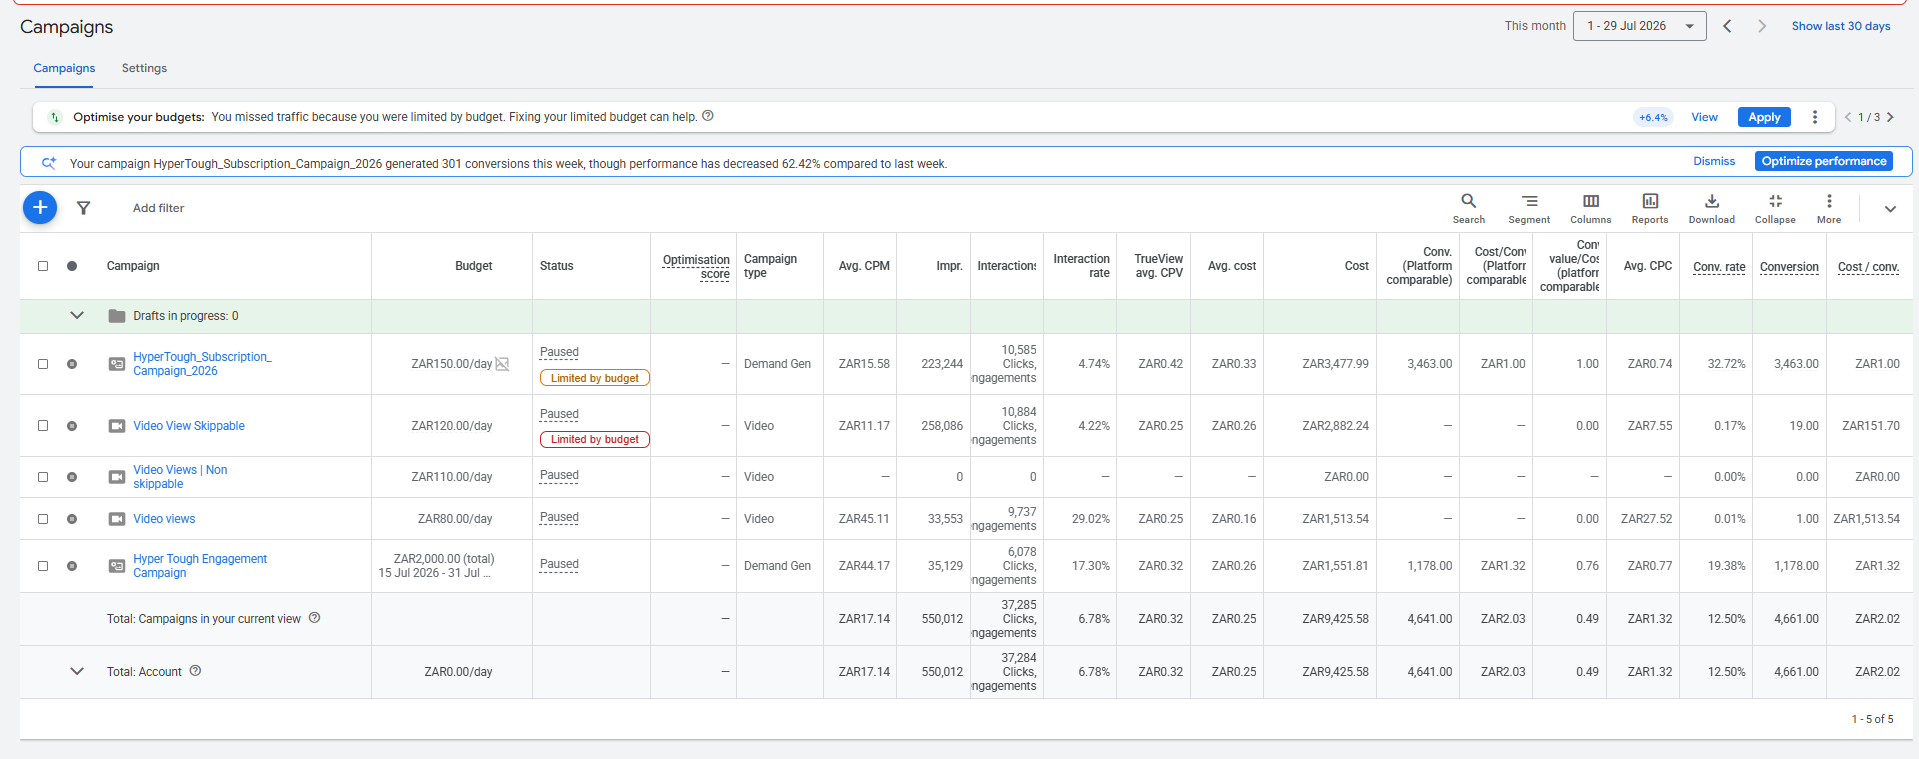
Hyper Tough: Google Ads Campaigns: July 2026 (month to date)
Google Ads Campaigns: July 2026 (month to date)

Recommendations & outcomes

Recommendation: Full-funnel structure

Continue using the full-funnel campaign structure and budget allocation to incorporate reach, engagement, and subscription objectives, using the subscription and video view campaigns to support the full customer journey.

Outcome

Applied: spend was deliberately weighted toward subscriptions, which is why new subscribers landed well above target in both months (4,269 vs. 1,610 est. in May; 2,172 vs. 1,610 est. in June), while engagement came in under target both months (23,842 vs. 95,000 in May; 30,226 vs. 95,000 in June): a gap by design, not execution, and engagement itself still grew 27% month over month.

Recommendation: Content format & targeting

Introduce interactive content formats (product-use tutorials, “which Hyper Tough product do you use most”) with strong, click-worthy thumbnails to lift average view duration and drive engagement; allocate additional budget toward the top-converting 25–44 age group, mobile devices, and top-performing locations and campaigns.

Outcome

Partially followed: the 25–34 and 35–44 age groups remained the strongest conversion drivers in both months (2,135 combined with 18–24 in June), and mobile continued to dominate device performance (551K impressions, 3,149 conversions in June). Average view duration is still around 00:23, so the shift to tutorial/demonstration-style content is the next step still to be executed.